
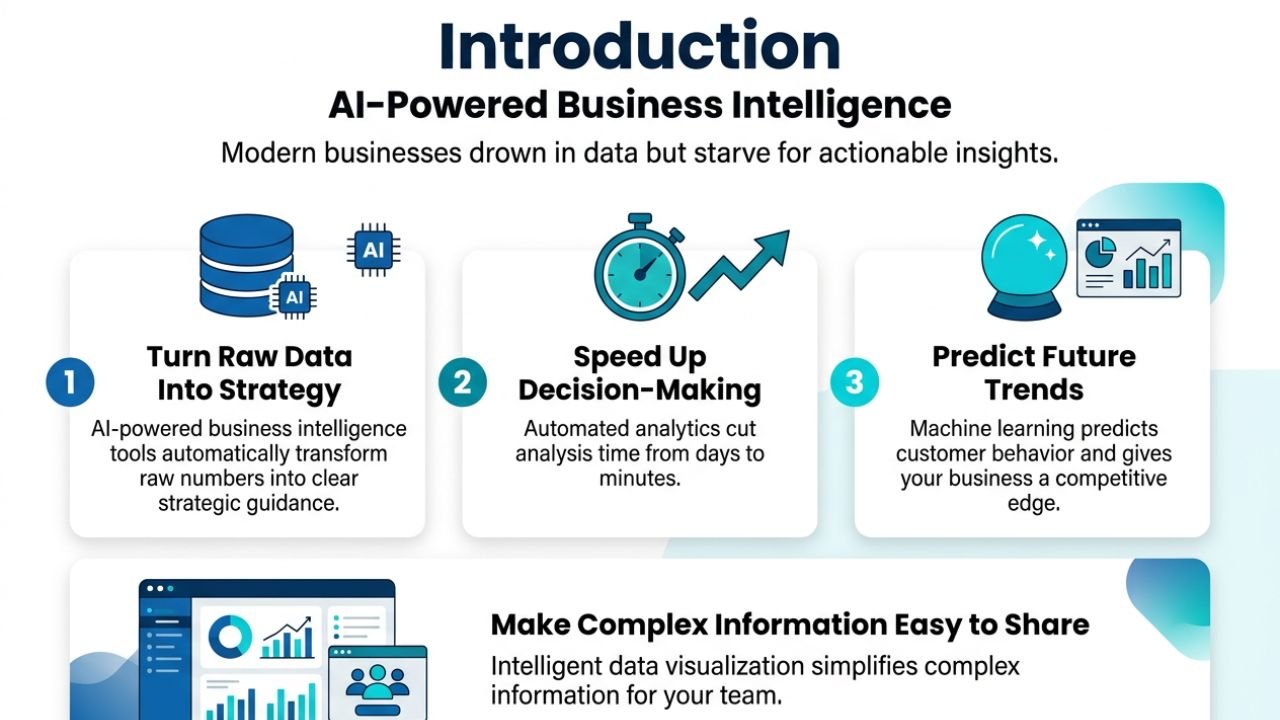
Modern businesses drown in data but starve for actionable insights. AI-powered business intelligence tools for data-driven decisions change this reality by automatically turning raw numbers into clear strategic guidance.
This guide is designed for business leaders, data analysts, and decision-makers who want to harness artificial intelligence to improve their company’s performance. You’ll discover practical ways to implement these tools without needing a PhD in data science.
We’ll explore how automated analytics can speed up your decision-making process, cutting analysis time from days to minutes. You’ll also learn how machine learning algorithms can predict future trends and customer behavior, giving your business a competitive edge. Finally, we’ll show you how intelligent data visualization makes complex information easy to understand and share across your team.
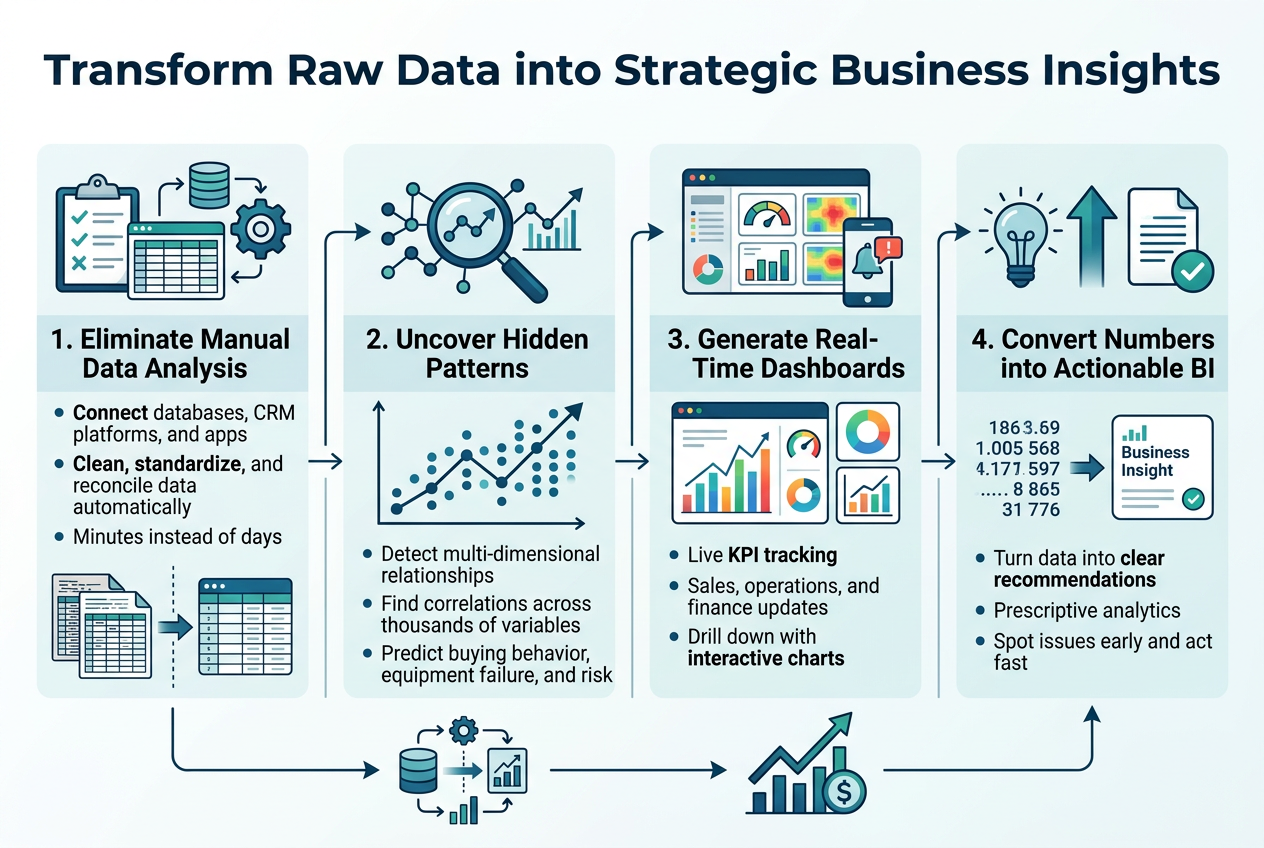
Transform Raw Data into Strategic Business Insights
Eliminate Time-Consuming Manual Data Analysis
Manual data analysis eats up countless hours that your team could spend on strategy and growth. Spreadsheet warriors know the pain of copying, pasting, and cross-referencing data from multiple sources, only to discover errors that render their work useless. AI-powered business intelligence tools handle these repetitive tasks automatically, freeing your analysts to focus on interpretation and strategic thinking rather than data wrangling.
These intelligent systems connect to your existing databases, CRM platforms, and third-party applications without requiring complex integrations. They clean messy data, standardize formats, and reconcile discrepancies across different sources. What used to take days of manual work now happens in minutes, with accuracy rates that far exceed human capabilities.
Your team can shift from being data processors to data strategists. Instead of spending 80% of their time preparing data and 20% analyzing it, AI flips this ratio entirely. The result is faster insights, reduced human error, and employees who actually enjoy their analytical work again.
Uncover Hidden Patterns in Complex Datasets
Complex datasets hide valuable insights that traditional analysis methods miss entirely. Your customer transaction data might reveal seasonal buying patterns that occur across multiple product categories simultaneously. AI algorithms excel at detecting these multi-dimensional relationships that would take humans weeks to identify manually.
Machine learning models can analyze thousands of variables at once, spotting correlations between seemingly unrelated factors. They might discover that customers who purchase product A on Tuesdays are 40% more likely to buy product B within the following month, but only if they live in specific geographic regions. These granular insights drive highly targeted marketing campaigns and inventory decisions.
Pattern recognition extends beyond customer behavior to operational efficiency, supply chain optimization, and risk management. AI can identify early warning signs of equipment failure, predict cash flow shortages before they occur, and flag potential security threats in real-time. The technology continuously learns from new data, improving its pattern detection capabilities over time.
Generate Real-Time Performance Dashboards
Real-time dashboards transform how leadership teams monitor business performance. Gone are the days of waiting for monthly reports to understand what happened weeks ago. Modern BI tools stream live data directly to customizable dashboards that update automatically as new information arrives from your systems.
These dashboards provide instant visibility into key performance indicators across all business functions. Sales teams see pipeline progression and conversion rates updating throughout the day. Operations managers monitor production efficiency, quality metrics, and supply chain status in real-time. Financial leaders track cash flow, expense trends, and revenue performance as transactions occur.
The visual nature of these dashboards makes complex data accessible to non-technical stakeholders. Interactive charts, heat maps, and trend lines tell stories that spreadsheets cannot. Teams can drill down from high-level metrics to granular details with simple clicks, enabling rapid problem identification and resolution.
Mobile-responsive designs ensure critical information stays accessible whether executives are in boardrooms or traveling. Push notifications alert decision-makers when metrics exceed predetermined thresholds, enabling immediate corrective action.
Convert Numbers into Actionable Business Intelligence
Raw numbers mean nothing without context and interpretation. AI-powered BI tools excel at transforming statistical data into clear business recommendations. They identify trends, calculate statistical significance, and present findings in plain language that drives immediate action.
These systems go beyond simple reporting to provide prescriptive analytics. Instead of just showing that sales declined 15% last quarter, they explain why it happened and recommend specific steps to reverse the trend. They might suggest adjusting pricing strategies, reallocating marketing budgets, or targeting different customer segments based on data-driven insights.
Automated insight generation ensures important discoveries don’t get lost in data overload. The technology continuously monitors your metrics and surfaces the most critical findings for leadership review. This proactive approach to business intelligence prevents small issues from becoming major problems and helps organizations capitalize on emerging opportunities quickly.
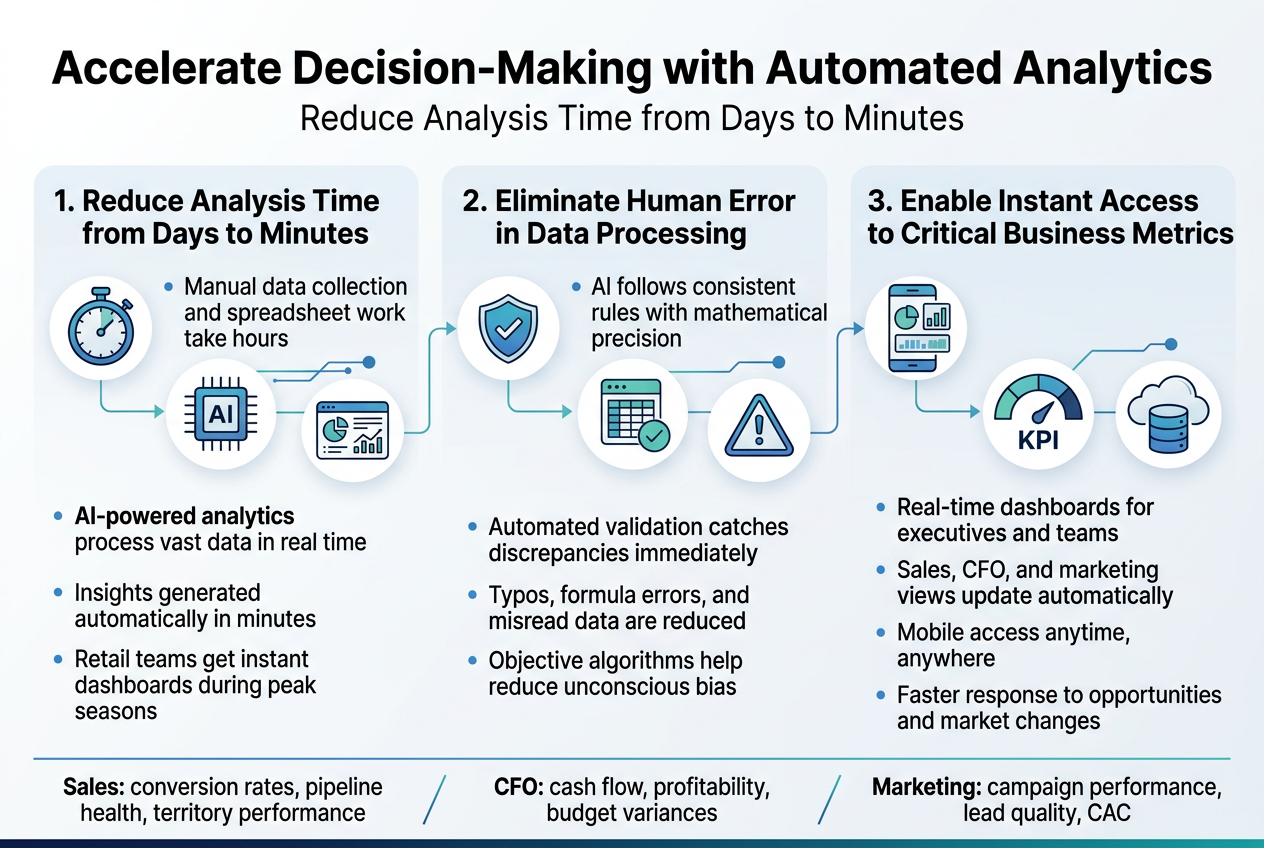
Accelerate Decision-Making with Automated Analytics
Reduce Analysis Time from Days to Minutes
Traditional business intelligence often involves manual data collection, spreadsheet manipulation, and hours of number crunching. AI-powered analytics platforms eliminate these bottlenecks by automatically processing vast amounts of data in real-time. What once required entire teams working for days now happens in minutes with automated algorithms running continuously in the background.
Modern BI tools connect directly to your data sources – whether that’s your CRM, ERP system, or cloud databases – and immediately begin generating insights. Machine learning algorithms identify patterns, anomalies, and trends without human intervention. This means your team can focus on strategic decision-making rather than data preparation and basic analysis.
Consider retail businesses during peak shopping seasons. Instead of waiting days for sales reports, automated analytics provide instant dashboards showing real-time performance metrics, inventory levels, and customer behavior patterns. This speed advantage becomes crucial when market conditions change rapidly or competitors make strategic moves.
Eliminate Human Error in Data Processing
Manual data handling introduces countless opportunities for mistakes. Typos in spreadsheets, incorrect formulas, and misinterpreted data points can lead to costly business decisions. AI systems process information with mathematical precision, following consistent rules and methodologies every time.
Automated validation checks catch discrepancies immediately. If sales figures don’t match between systems or if unusual patterns emerge, the AI flags these issues before they propagate through reports. This reliability builds confidence in your data and ensures leadership makes decisions based on accurate information.
Human analysts also bring unconscious biases to their work. They might focus on data that confirms existing beliefs or overlook subtle but important trends. AI algorithms approach data objectively, weighing all factors according to their statistical significance rather than human assumptions.
Enable Instant Access to Critical Business Metrics
Executive teams need immediate visibility into key performance indicators without waiting for IT departments or analysts to generate custom reports. AI-powered dashboards provide real-time access to essential metrics through intuitive interfaces that anyone can navigate.
These systems learn which metrics matter most to different roles within your organization. Sales managers automatically see conversion rates, pipeline health, and territory performance. CFOs get instant updates on cash flow, profitability, and budget variances. Marketing teams track campaign performance, lead quality, and customer acquisition costs.
Mobile accessibility means decision-makers can check critical metrics anywhere, anytime. Whether you’re in client meetings, traveling, or working remotely, your most important business data stays at your fingertips. This immediacy transforms how quickly your organization can respond to opportunities and challenges in today’s fast-moving business environment.
Leverage Machine Learning for Predictive Business Forecasting
Anticipate Market Trends Before Competitors
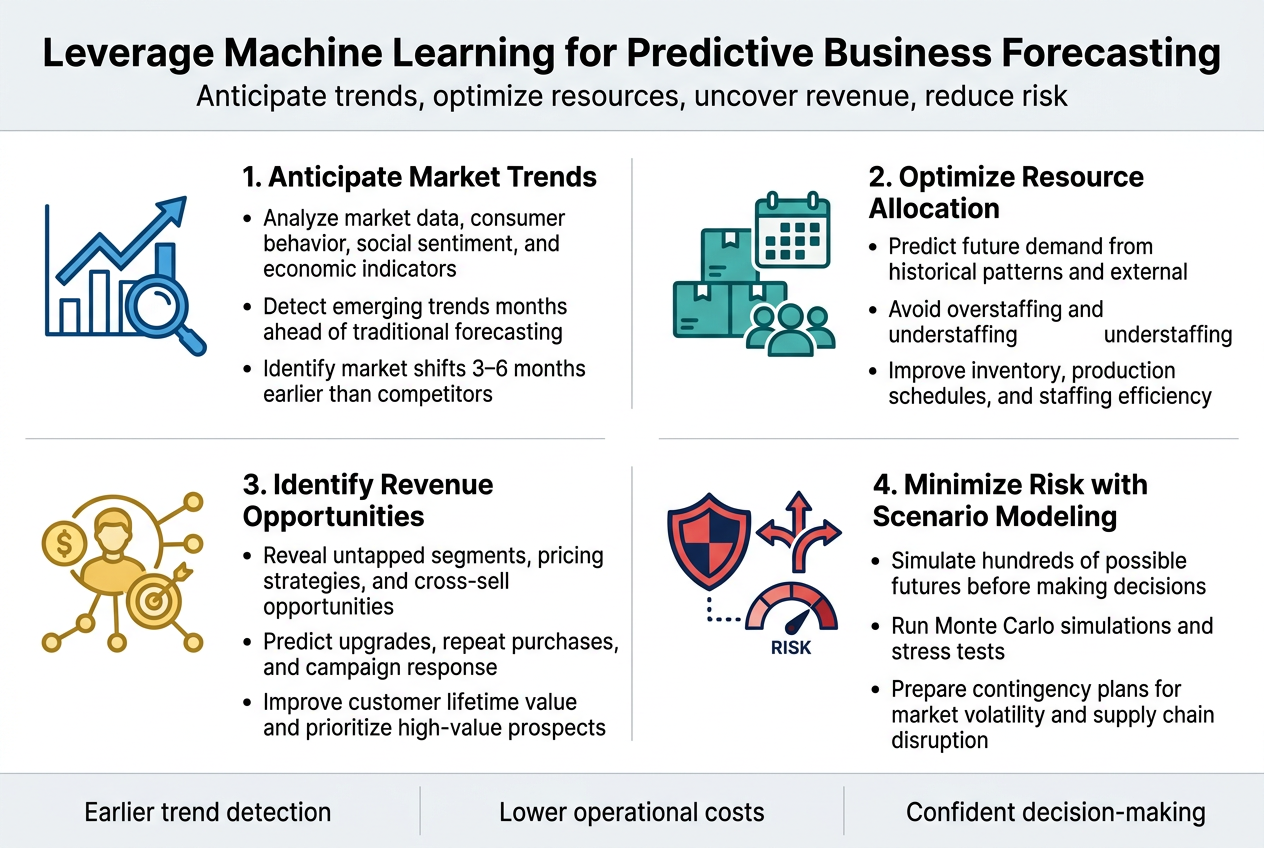
Machine learning algorithms excel at spotting subtle patterns in massive datasets that human analysts often miss. These AI-powered systems continuously analyze market data, consumer behavior, social media sentiment, and economic indicators to predict emerging trends months ahead of traditional forecasting methods. Your business gains a crucial competitive advantage when you can identify market shifts before they become obvious to everyone else.
Advanced neural networks process thousands of data points simultaneously, from seasonal purchasing patterns to geopolitical events that might affect supply chains. This comprehensive analysis reveals hidden correlations that inform strategic decisions. Companies using predictive analytics report identifying market opportunities 3-6 months earlier than competitors relying on traditional market research alone.
Optimize Resource Allocation Based on Future Demand
Predictive forecasting transforms how businesses allocate their most valuable resources – time, money, and personnel. Machine learning models analyze historical demand patterns, seasonal fluctuations, and external factors to predict future resource needs with remarkable accuracy. This foresight prevents both costly overstaffing during slow periods and missed opportunities from being understaffed during peak demand.
Smart inventory management becomes possible when algorithms predict which products will see increased demand and when. Manufacturing companies reduce waste by adjusting production schedules based on predicted market demand, while service businesses optimize staffing levels to match anticipated customer volume. The result is improved efficiency and significantly reduced operational costs.
Identify Revenue Opportunities Through Pattern Recognition
Machine learning uncovers revenue opportunities hiding in plain sight within your existing data. These systems detect patterns in customer behavior that reveal untapped market segments, optimal pricing strategies, and cross-selling opportunities that traditional analysis overlooks. Pattern recognition algorithms identify which customers are most likely to upgrade services, make repeat purchases, or respond to specific marketing campaigns.
Customer lifetime value predictions become incredibly precise when AI analyzes purchasing history, engagement patterns, and demographic data. This insight helps prioritize high-value prospects and customize offerings to maximize revenue potential. Businesses report discovering new revenue streams worth millions simply by letting machine learning algorithms analyze their existing customer data from fresh angles.
Minimize Risk with Advanced Scenario Modeling
Sophisticated scenario modeling capabilities allow businesses to test hundreds of potential futures and their impacts on operations before making critical decisions. Machine learning models simulate various market conditions, competitive responses, and economic scenarios to identify potential risks and their likelihood of occurrence. This proactive approach to risk management prevents costly mistakes and prepares organizations for multiple contingencies.
Monte Carlo simulations and other advanced modeling techniques process thousands of variables simultaneously to create comprehensive risk assessments. Financial institutions use these models to stress-test portfolios against market volatility, while retailers model supply chain disruptions to develop contingency plans. The ability to quantify risk across multiple scenarios enables confident decision-making even in uncertain environments.
Streamline Operations with Intelligent Data Visualization
Create Interactive Reports That Drive Action
Interactive reports transform static spreadsheets into powerful decision-making tools that encourage immediate engagement from stakeholders. Unlike traditional reports that present fixed data snapshots, interactive dashboards allow users to drill down into specific metrics, filter results by various parameters, and explore different scenarios in real-time. This hands-on approach means executives and team leaders can identify trends, spot anomalies, and uncover opportunities without waiting for IT support or data analysts to run custom queries.
The most effective interactive reports incorporate clickable elements, hover-over details, and dynamic filtering options that respond instantly to user input. Sales teams can click through regional performance data to identify top-performing territories, while marketing departments can adjust date ranges to compare campaign effectiveness across different timeframes. These reports often include alert systems that highlight critical metrics requiring immediate attention, such as inventory shortages or customer satisfaction drops below acceptable thresholds.
Modern BI platforms enable report creators to embed contextual information directly into visualizations, providing background explanations and recommended actions alongside the data itself. This approach eliminates guesswork and empowers users at all levels to make informed decisions based on comprehensive insights rather than surface-level numbers.
Simplify Complex Information for Executive Teams
Executive leadership requires high-level insights delivered in digestible formats that support strategic decision-making without overwhelming busy schedules. The key lies in distilling complex datasets into clear, visually compelling summaries that highlight the most critical business metrics and their implications for company performance.
Effective executive dashboards prioritize key performance indicators (KPIs) that directly impact business objectives, presenting them through intuitive visualizations like trend lines, heat maps, and progress gauges. Rather than displaying dozens of metrics, these dashboards focus on the vital few that truly matter for strategic planning. Revenue trends, customer acquisition costs, market share changes, and operational efficiency metrics take center stage, while supporting details remain accessible through drill-down capabilities.
Color coding and visual hierarchy guide attention to areas requiring executive focus. Red indicators signal urgent issues needing immediate intervention, yellow highlights emerging concerns worth monitoring, and green confirms positive performance trends. Exception-based reporting automatically surfaces unusual patterns or significant deviations from expected performance, ensuring executives don’t miss critical developments buried within routine operational data.
Storytelling elements woven throughout these simplified reports provide context that raw numbers alone cannot convey, helping leadership understand not just what happened, but why it matters for future business direction.
Build Custom Dashboards for Different Departments
Department-specific dashboards address the unique needs, priorities, and workflows of different business functions while maintaining consistency in overall data governance and visualization standards. Sales teams require real-time pipeline visibility, conversion rate tracking, and territory performance comparisons, while human resources departments focus on employee engagement metrics, recruitment efficiency, and compliance monitoring.
Manufacturing operations benefit from dashboards displaying production schedules, quality control metrics, equipment utilization rates, and supply chain status updates. Marketing teams need campaign performance analytics, lead generation statistics, customer journey mapping, and brand sentiment tracking. Finance departments require cash flow projections, budget variance analysis, profitability breakdowns, and regulatory compliance status indicators.
The customization process involves close collaboration between BI developers and departmental stakeholders to identify the most relevant data sources, optimal refresh frequencies, and preferred visualization styles for each user group. Role-based access controls ensure team members see only the information relevant to their responsibilities while protecting sensitive data from unauthorized viewing.
| Department | Key Metrics | Update Frequency | Primary Users |
|---|---|---|---|
| Sales | Pipeline value, conversion rates, quota attainment | Real-time | Sales reps, managers |
| Marketing | Campaign ROI, lead quality scores, web traffic | Daily | Marketing managers, analysts |
| Operations | Production output, quality metrics, efficiency | Hourly | Plant managers, supervisors |
| Finance | Cash flow, budget variance, profitability | Weekly | CFO, controllers, analysts |
Cross-departmental integration capabilities allow different teams to share relevant insights while maintaining their specialized views, promoting better coordination and alignment across the entire organization.
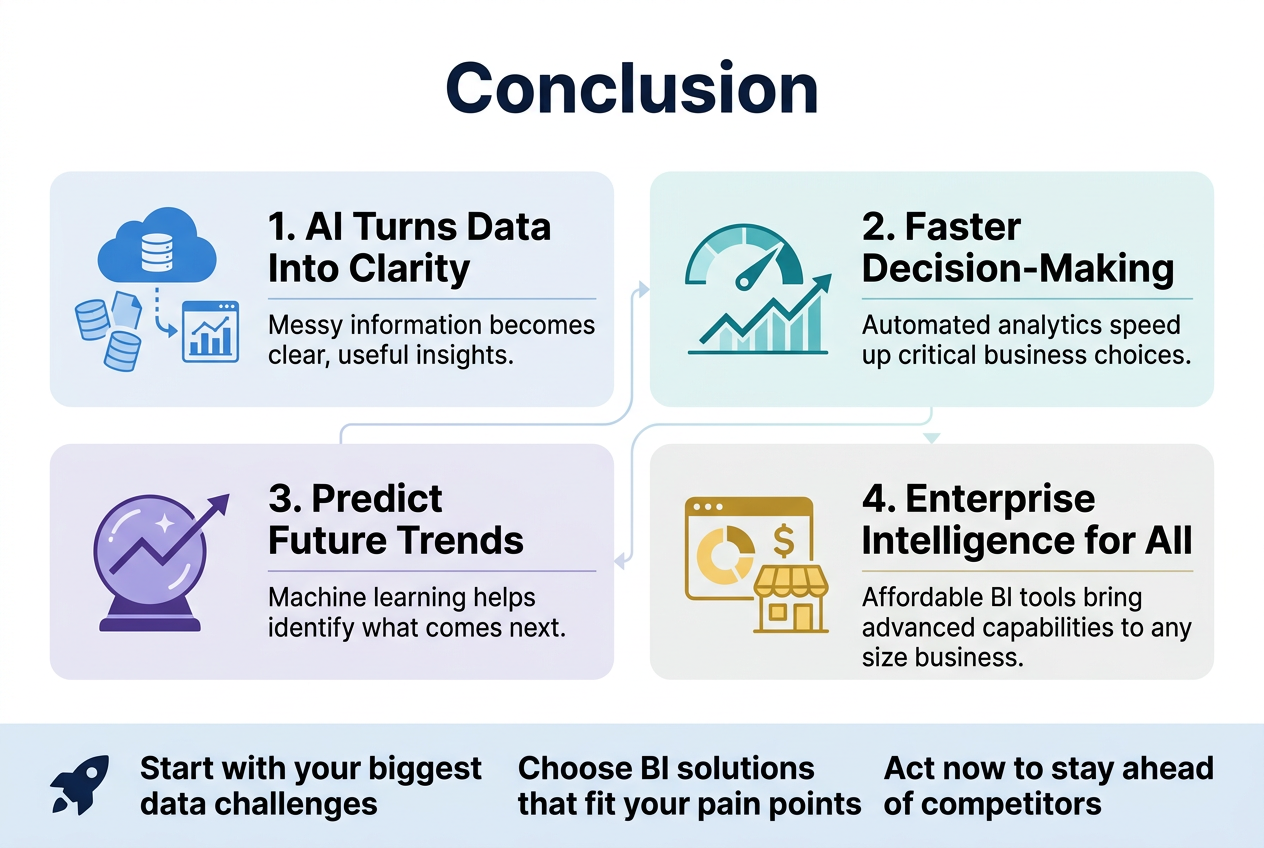
AI-powered business intelligence tools have completely changed how companies handle their data and make critical decisions. These smart platforms turn messy, overwhelming information into clear insights that actually matter. They speed up the whole decision-making process through automated analytics, predict future trends using machine learning, and present complex data in ways that anyone can understand. Best of all, they give businesses of any size access to enterprise-level intelligence capabilities without breaking the bank.
The companies that embrace these AI-driven tools today will have a major advantage tomorrow. Start by identifying your biggest data challenges and look for BI solutions that address those specific pain points. Don’t wait for your competitors to get ahead – the technology is ready, affordable, and easier to implement than ever before. Your data is already there waiting to unlock growth opportunities and drive smarter business strategies.